What the 2026 Midterms Taught Us About Forecasts, and What 2028 Campaigns Should Do About It
Key takeaways
- Prediction markets like Kalshi offer three advantages over traditional polling: slightly better accuracy, far broader coverage, and free, real-time data from traders who put real money behind their predictions.
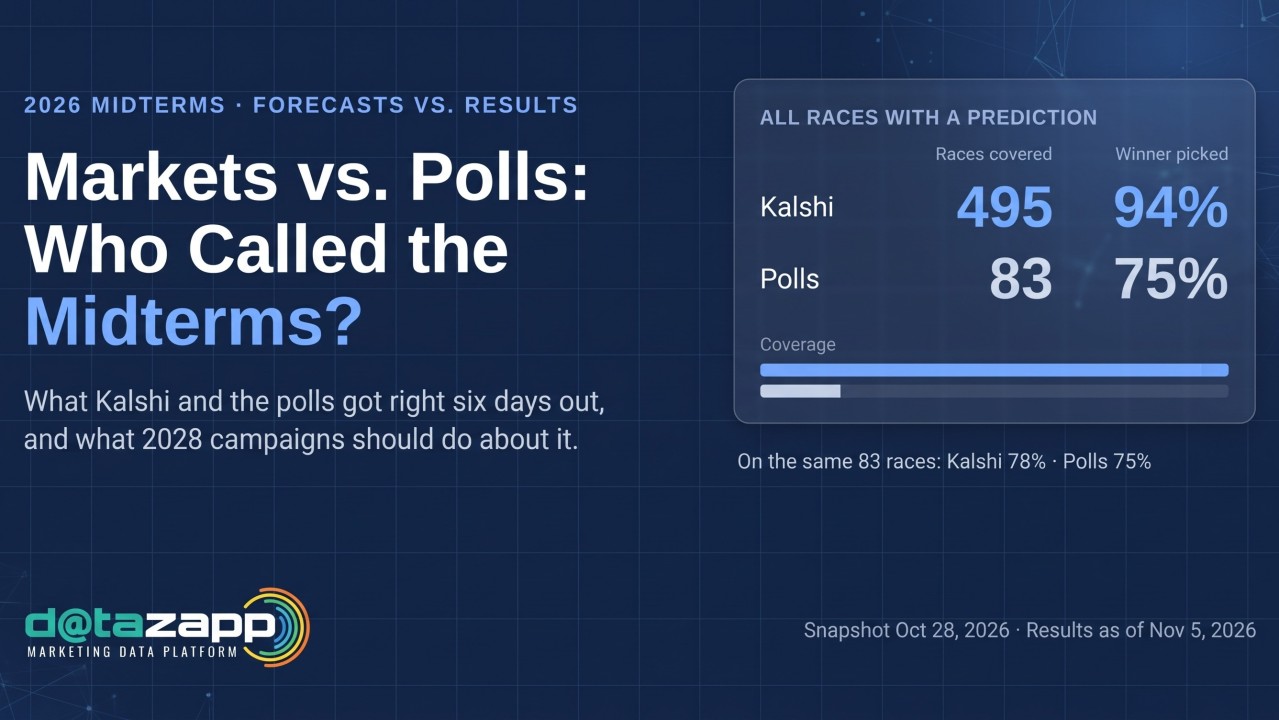
- Accuracy: six days before the election, Kalshi's favorite won 94% of all the races it covered. On the 83 races where both Kalshi and a poll picked a winner, Kalshi was right 78% of the time and the latest poll 75%.
- Coverage: Kalshi had odds on 497 of the 506 Senate, House and governor races on the ballot, down to small, low-profile House districts. Public polling focuses on statewide and high-profile races, and many House districts never get a public poll.
- Data: Kalshi's prices are free to view, update in real time, and reflect the combined judgment of traders with money on the line.
- The opportunity for 2028: candidates, campaigns and political agencies can use this real-time data to spot competitive races early, adjust their message, and boost outreach while there's still time to change the result.
On October 28, six days before Election Day, we took a snapshot of every 2026 midterm race. For each one we recorded Kalshi's prediction-market odds and the latest public poll. After the votes were counted, we compared both against the results.
| Race | Kalshi: all races it covered | Polls: all races with a poll | Same races: Kalshi | Same races: Polls |
|---|---|---|---|---|
| Senate | 89% 31 of 35 | 79% 22 of 28 | 86% 24 of 28 | 79% 22 of 28 |
| Governor | 94% 34 of 36 | 87% 27 of 31 | 94% 29 of 31 | 87% 27 of 31 |
| House | 94% 400 of 424 | 54% 13 of 24 | 50% 12 of 24 | 54% 13 of 24 |
| Total | 94% 465 of 495 | 75% 62 of 83 | 78% 65 of 83 | 75% 62 of 83 |
Share of races where the predicted favorite won. "Same races" covers the 83 races where both Kalshi and a poll picked a winner.
What the numbers say
Kalshi covered far more races and picked the winner in 94% of them, but much of that comes from safe seats that were easy to call. The fairer test is the 83 races where both a market and a poll made a pick. There, Kalshi was right 78% of the time and the latest poll 75%. Kalshi's edge came from Senate and governor races. In the close House races, both did little better than a coin flip.
The bigger story is where the forecasts were unsure. In the 48 races where Kalshi's favorite was priced below 75%, the underdog won 23, nearly half. When the favorite was priced at 90% or higher, it lost only once in 385 races. Every race Kalshi got wrong also broke the same way, toward the Democrat. A 65% favorite isn't safe. Six days out, those close races were still open for whichever campaign acted first.
A note on accuracy claims
After the election, Kalshi Research published a working paper reporting 98.2% accuracy for its midterm markets.1 That figure measures Kalshi's prices at the moment polls closed in each state, for races called by the next morning. By then campaigning is over. The same paper shows what happens earlier: 95.7% a week out, 94.3% a month out and 93.8% three months out. Our six-day snapshot came in at 94%, in line with their one-week figure.
The lesson for 2028: use forecasts as an early warning, not a scoreboard
- Watch the signal early. Track prediction markets alongside polls, and treat any race below about 75% as competitive. Kalshi's own research shows markets were informative months in advance.1 By the final week, mail is already in the mailbox and early voting is under way.
- Fit the message to the gap. A narrow favorite should lock down its base and protect turnout. An underdog in a close race should invest in persuasion and new voters, because the odds say the race can be won.
- Reach the people who decide it. Close races come down to who shows up: registered voters who need a reason to vote, eligible residents who haven't registered yet, and donors who can fund the final push.
Where DataZapp comes in
DataZapp helps campaigns and candidates build audiences fast: voter files, unregistered-voter data and political donor data, ready for mail, phone, digital and door-knocking. Already have a list? Bring your own data and we'll append cell phones and emails. Average turnaround is 15 minutes or less.
How campaigns can put forecast signals to work:
- Trailing in a close race? Pull unregistered voters in your district and run a registration drive while deadlines are still open.
- Narrow favorite? Pull the voter file for your strongest areas and get supporters to the polls with texts, calls and door-knocking.
- Odds just moved your way? Reach political donors in your state or district for a fast fundraising push to pay for the final stretch.
- Have a supporter list with only names and addresses? Append cell phones and emails so you can reach those supporters by text and email the same day.
- Agency running several races? Watch the markets across your races and build audiences in minutes wherever a race tightens.
The forecast tells you where the fight is. Our data helps you reach the right people quickly, while there's still time to change the outcome.
Explore DataZapp political dataMethodology: Forecasts were captured October 28, 2026, using Kalshi market prices and the latest public poll for each race, not a polling average. Results are from CNN's count as of November 5, 2026. Uncalled races are scored on the current leader, and Louisiana's 5th and 6th House districts, which went to runoffs, are excluded. "Same races" covers the 83 races where both Kalshi and a poll picked a winner; five tied polls are excluded. House polls were collected only for the 35 most competitive districts, 28 of which had a poll. Kalshi Research's own polling comparison1 uses polling averages rather than single polls, so its figures differ from ours.
Sources
1. Kagan, N., and Baiocchi, R. (2026). Kalshi and the 2026 Midterms: Calibration and Accuracy. Kalshi Research Working Paper, November 2026. Preliminary; the authors note it will be updated as more races are called.
2. Kalshi market data, kalshi.com/category/elections/midterms, retrieved October 28, 2026.
3. Polling: RealClearPolling, Wikipedia, Ballotpedia and pollster releases, retrieved October 28, 2026.
4. Results: CNN election results data, retrieved November 5, 2026.
See the Difference. Get Started with Datazapp
You can create an account below to get started. It’s completely free to explore our database and see what we have to offer!